Lipimetry
Lipimetry assesses the lipid layer of the preocular tear film by analysing its interference colours. The lipid layer reduces evaporation, supports tear-film stability and is closely related to meibomian gland function. In dry eye disease, particularly evaporative dry eye, lipid-layer assessment can help identify a thin, irregular or unstable lipid layer and provides an objective measure that can be followed alongside symptoms, slit-lamp findings, meibography and tear-film stability tests.
How to do the test
- Before starting Lipimetry, attach the conical attachment with the cap on.
- Select Lipimetry in the top toolbar and wait until the popup message “Lipimetry ready” appears.
- Remove the cap and position the patient comfortably in front of the device.
- Move the device forward towards the eye until a well-focused Purkinje one (P1) image is formed.
- Ask the patient to blink a few times.
- Click Acquire, or use the Bluetooth button if available. Results will be captured automatically once the required quality parameters are met.
Ideal capture timing: Capture after a blink, once the lipid layer has stabilised.
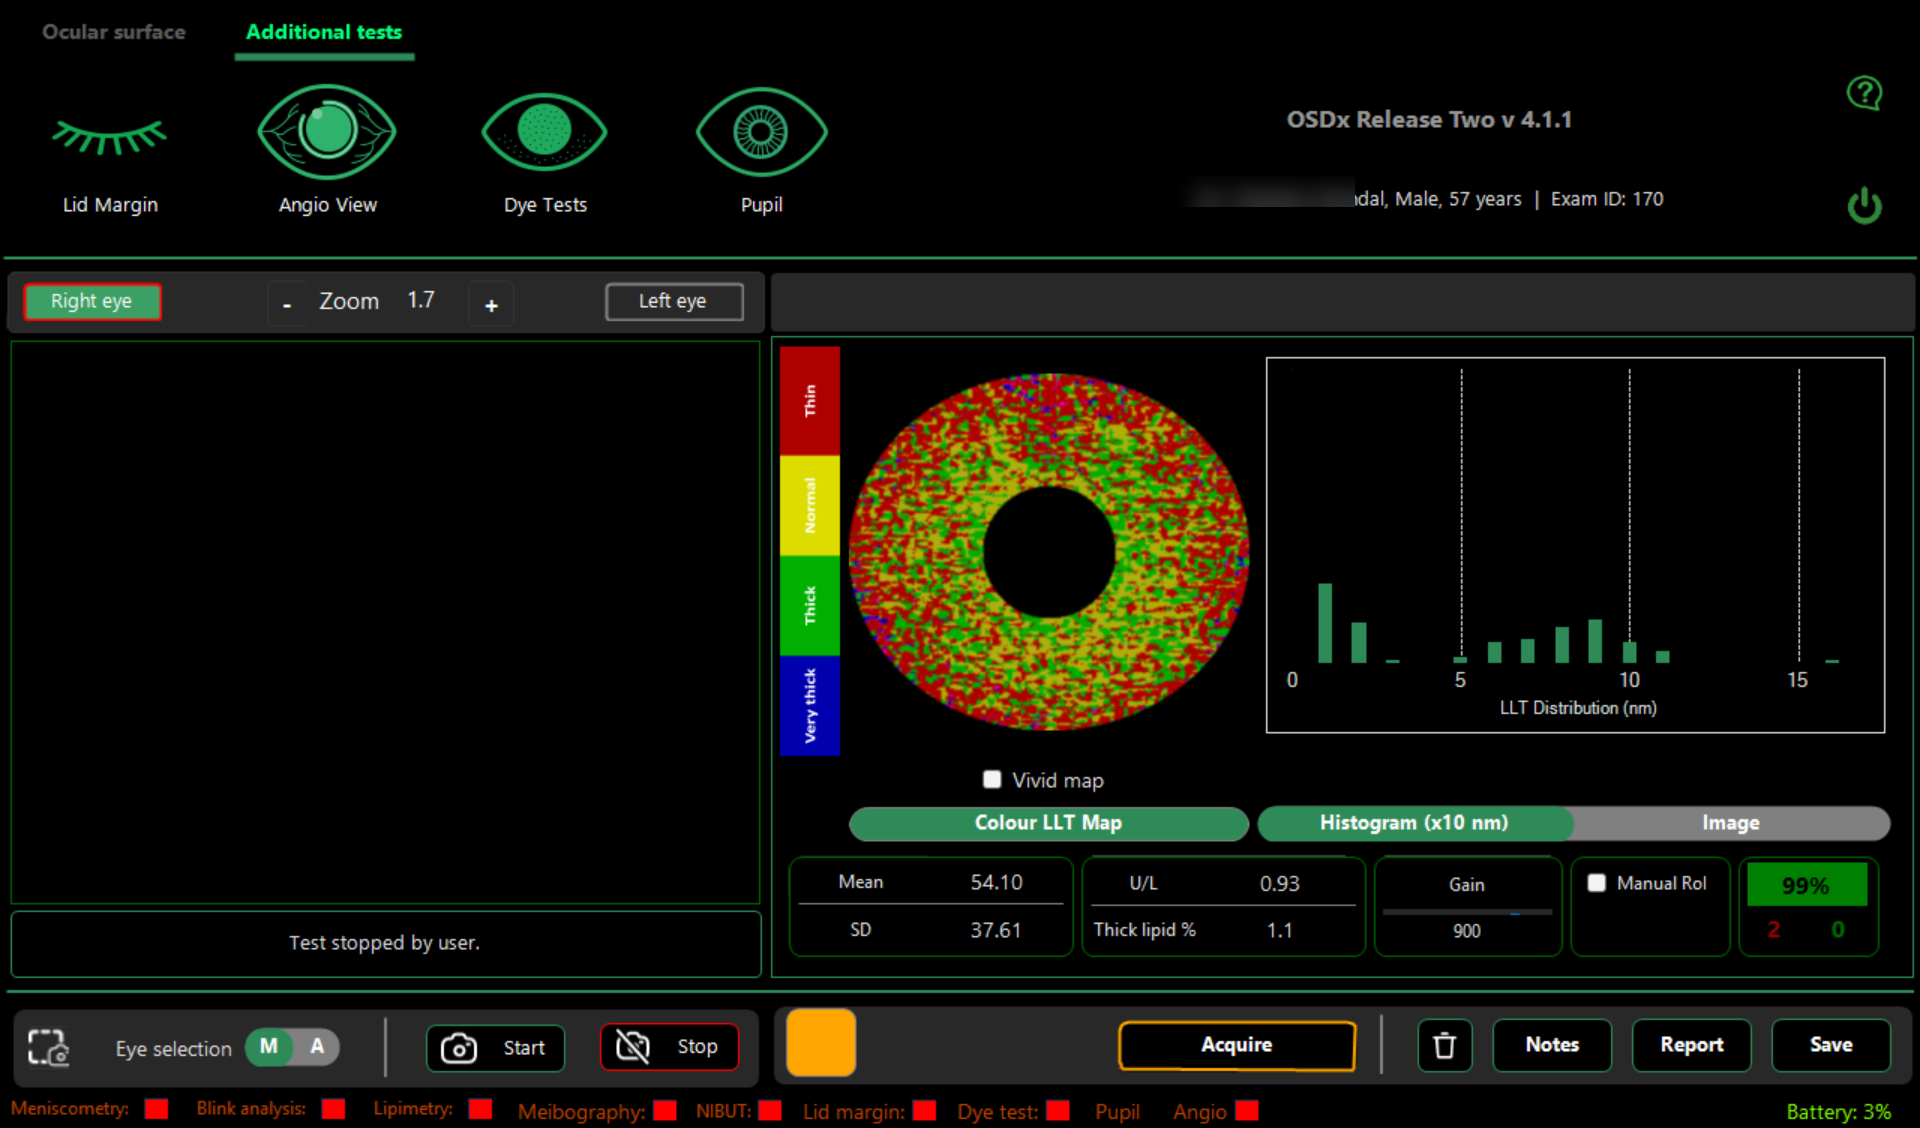
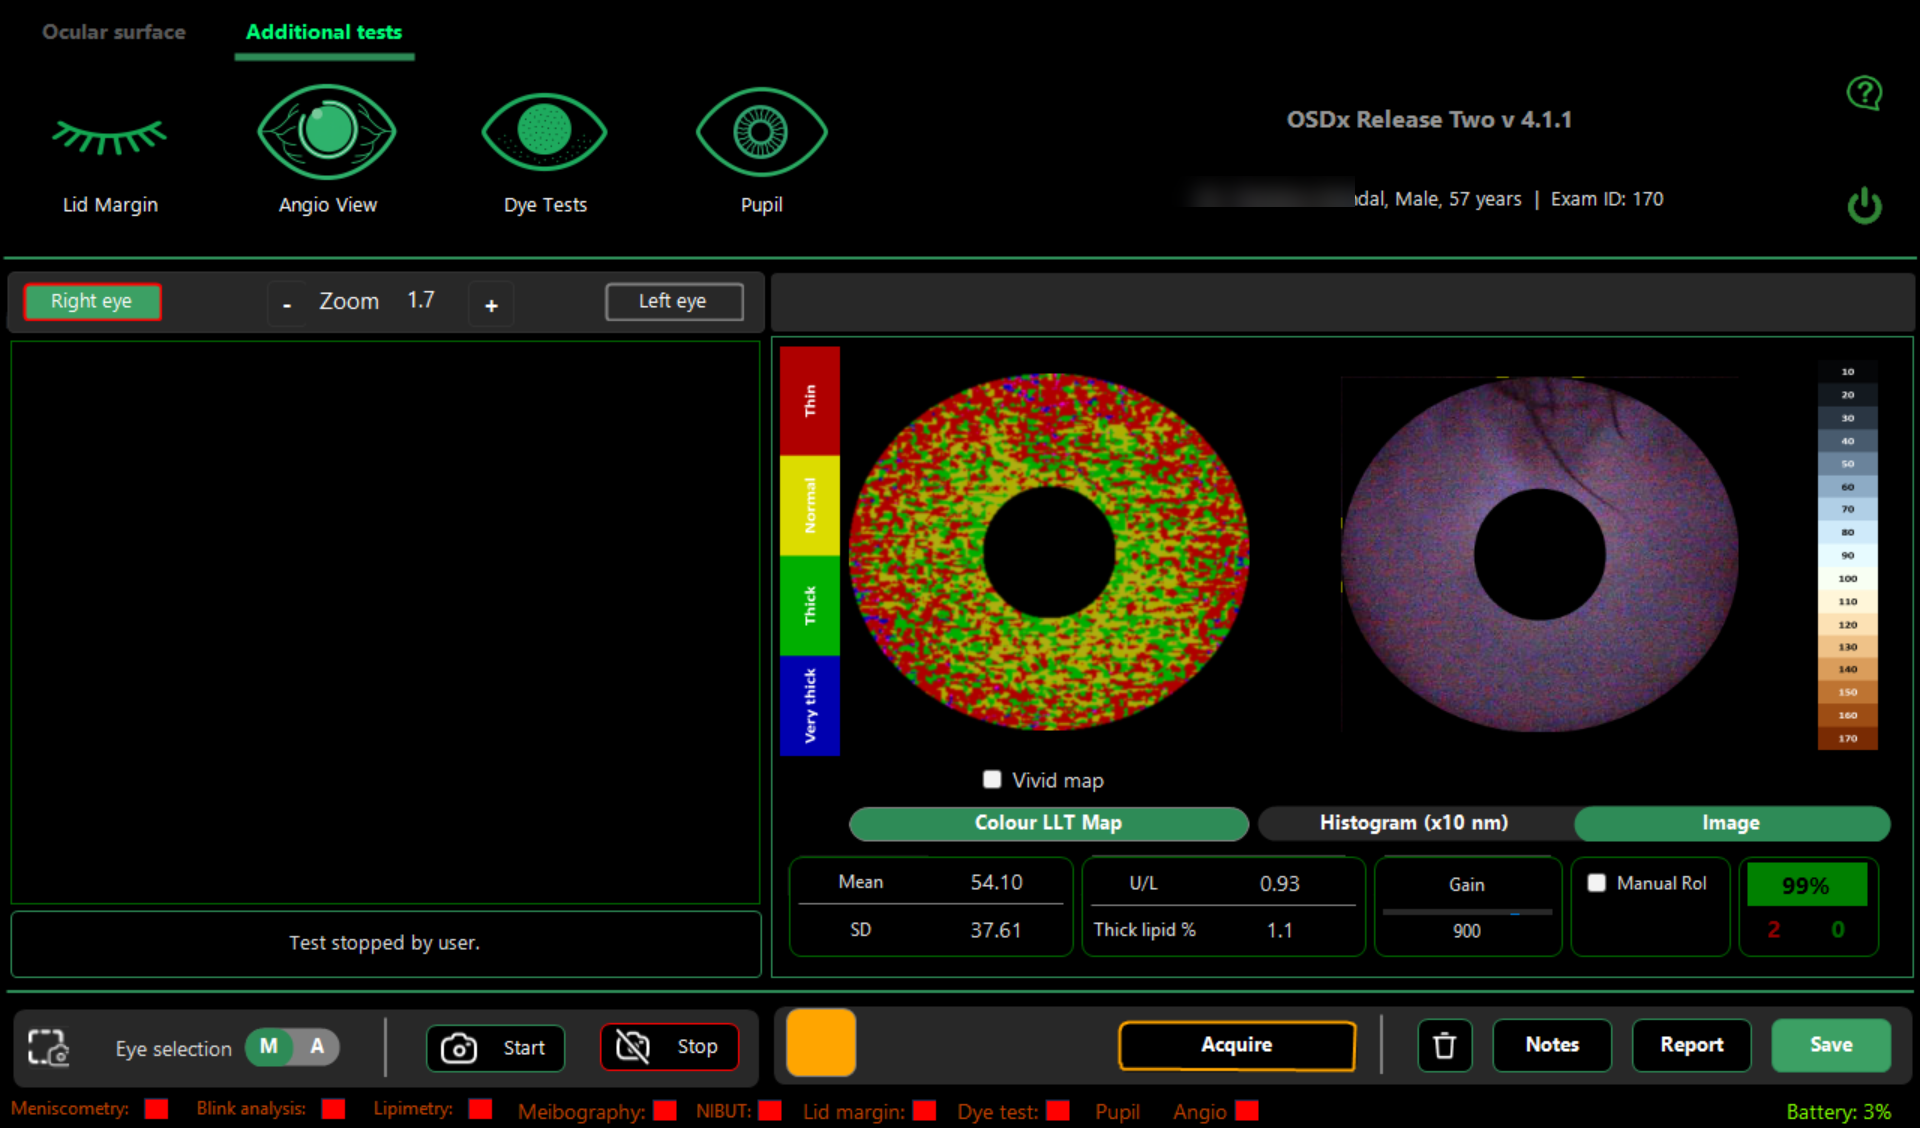
The right pane shows a colour-coded lipid-layer thickness map, a histogram showing the distribution of thickness, and an enhanced raw image of the tear-film interference pattern.
Parameters at a glance
Results workspace
Understanding the display
Colour LLT Map
The circular map shows the spatial distribution of lipid-layer thickness across the analysed tear-film area. Each valid pixel is assigned a thickness category and displayed according to the colour scale at the left of the map.
This is a processed thickness map intended to make regional variation easy to appreciate at a glance.
Vivid map vs summary map
Vivid map: displays the lipid-layer distribution using the full colour range, making smaller spatial differences more visible.
Summary map: groups values into broader categories — Thin, Normal, Thick and Very thick — so the overall pattern can be interpreted more quickly.
The Vivid map checkbox switches between these two displays of the same underlying measurement.
Histogram (×10 nm)
The histogram shows how the valid analysed pixels are distributed across lipid-layer thickness ranges. The horizontal axis represents lipid-layer thickness in 10 nm bins; the height of each bar reflects how many analysed pixels fall within that range.
A narrow distribution suggests a relatively uniform lipid layer, while a broader distribution indicates greater spatial variation.
Image
The Image view shows the captured tear-film interference pattern in its natural visible colours. It is useful for visually checking the quality of the acquisition and the interference pattern from which the thickness analysis has been derived.
Left colour bar — heat-map scale
The colour bar immediately to the left of the circular LLT map is the display scale used to generate the heat map. It is not the actual colour seen in the tear film.
It groups calculated lipid thickness into Thin, Normal, Thick and Very thick categories so regional variation is immediately apparent.
Right colour bar — actual tear-film interference colours
The vertical scale beside the Image view represents the actual interference colours observed in the tear film and their corresponding lipid-layer thickness values in nanometres.
Measured parameters
Mean LLT
The mean lipid-layer thickness (LLT), expressed in nanometres, is the average thickness calculated from all valid coded pixels in the analysed area.
A lower value indicates a thinner average lipid layer, while a higher value indicates a thicker average layer. It should be interpreted together with the distribution map and other dry-eye findings.
SD — standard deviation
SD describes how much lipid-layer thickness varies across the analysed area. A smaller SD indicates a more uniform lipid layer; a larger SD indicates greater spatial heterogeneity.
U/L ratio
The U/L ratio compares the mean lipid-layer thickness in the upper analysed region with that in the lower analysed region. A value around 1 indicates broadly similar upper and lower measurements.
Thick lipid %
This is the percentage of valid analysed pixels classified within the device's thicker lipid-layer range. It gives a quick indication of how much of the analysed area contains comparatively thick lipid.
Acquisition and quality controls
Manual ROI
Manual ROI is intended for calibration or troubleshooting and should not normally be used during routine clinical examination.
Leave the checkbox cleared when automatic detection is working normally. Use Manual ROI only when the P1 interference image is not being detected automatically.
Gain
Gain affects detection sensitivity during lipimetry analysis. The default setting should normally be left unchanged.
Adjust Gain only as a troubleshooting or calibration measure when the P1 interference image is not being detected automatically.
Colour-coded number box — coded pixels and clipping
Top green value: percentage of analysed pixels successfully coded with a lipid-layer thickness value.
Lower red value: percentage of pixels lost because of dark clipping; these pixels are too dark to analyse reliably.
Lower green value: percentage of pixels lost because of light clipping; these pixels are too bright or saturated to analyse reliably.
A high coded-pixel percentage with minimal clipping is desirable.
Light and dark clipping
Dark clipping occurs when pixel intensity is too low for reliable colour/thickness assignment. Light clipping occurs when pixels are excessively bright or saturated.
Both exclude pixels from the LLT calculation. Excessive clipping reduces the amount of reliable image data available for analysis.